By Max Liboiron and Alex Bond
We study plastic ingestion in animals harvested for food in Nunatsiavut, Inuit homelands in northern Labrador, Canada. This work is about more than just counting plastics. It’s about protecting Inuit food security and food sovereignty.
The good news is that most of the time, we don’t find plastics in these animals. That means our dataset is what researchers call “zero-rich”; it’s full of zeroes. From a health standpoint, that’s a great thing. But when we try to compare our findings to other studies around the world, we hit a problem.
Our data isn’t normally distributed, and that matters more than you might think.
What is a “Normal” Distribution?
In statistics, a normal distribution is a way of describing data where most values cluster around the average, and fewer are found as you move further away. It forms the classic bell curve — symmetrical, balanced, and predictable. This means that when you report an average, you’re reporting the middle-ish of the data. It’s a good summary for the data. For instance, if you have an 80% test average, people can assume you’re pretty good at tests.
Many studies about plastic ingestion report averages like this. But when your data is full of zeros, like ours, that model breaks down.
The Danger of Averages
In many studies, there will be a table like this (which reports our real data):
| Species | Sample size | Average # plastics/bird | Standard Deviation |
| All birds | 151 | 0.62 | 1.01 |
| Turr | 30 | 0.40 | 1.13 |
| Partridge | 73 | 0.67 | 1.01 |
The top graph below shows how many pieces of plastic were found in each bird in our research. Most birds didn’t eat any plastic at all. The average number of plastics per bird is 0.62. You can see the high bar at 0, indicating the large number of birds that ate 0 plastics. You can also see that there isn’t a normal distribution– there’s no bell-shaped curve with the largest count in the middle.
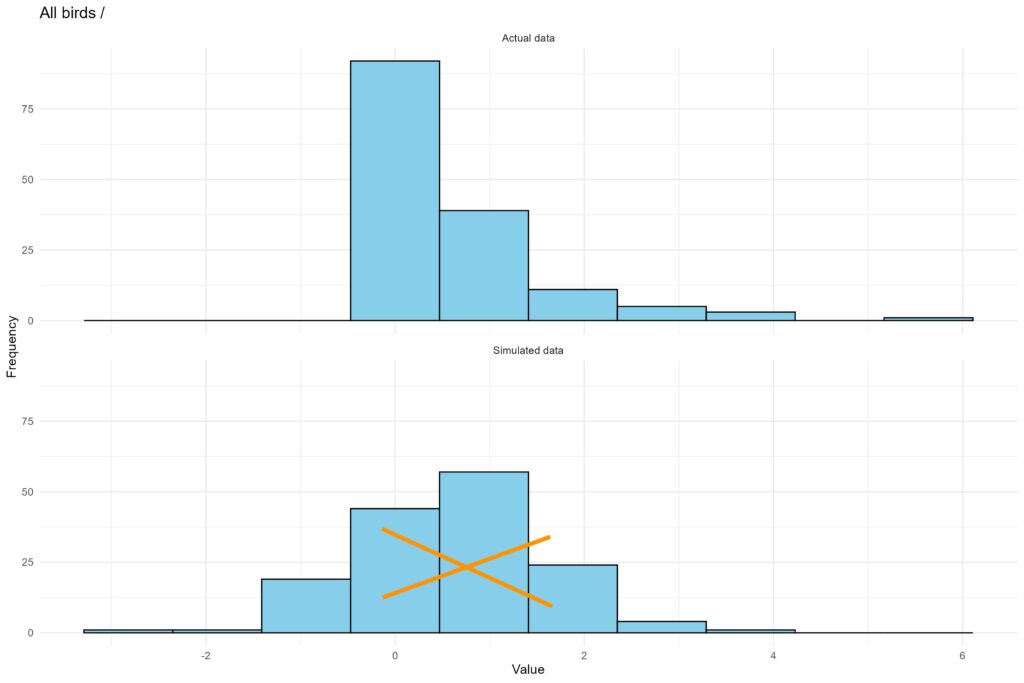
Bottom graph: The average number of plastics ingested per bird for this graph is also 0.62, but now the data is normally distributed. This graph was created by simulating a normal distribution of data for an average of 0.62 with the same sample size. We have an X over it so no one ever mistakes this for our data!
If we just reported the average– that out of all our birds, they each ate 0.62 plastics– it erases the zero, making it seem like plastic ingestion is more common than it is. That’s what the bottom graph does. It shows what a normal distribution of plastics would be if the average was 0.62. It’s what I, as a scientist, would imagine if I read just the summary of 0.62 and didn’t see the raw data.
This is a big deal when it comes to food safety, especially for Inuit relying on wild food. The zeros are crucial. Zero isn’t just the number before one. It’s the most important number in our dataset. If we use or report averages, we risk misunderstanding what’s really going on by hiding those crucial numbers.
Digging Deeper Into the Data
We also broke down the results by species. For two birds with the most samples, Thick-billed Murres (Turrs/appait) and Willow Ptarmigan (White partridges/aKigget), the same pattern shows up. The zeros get flattened out in the average.
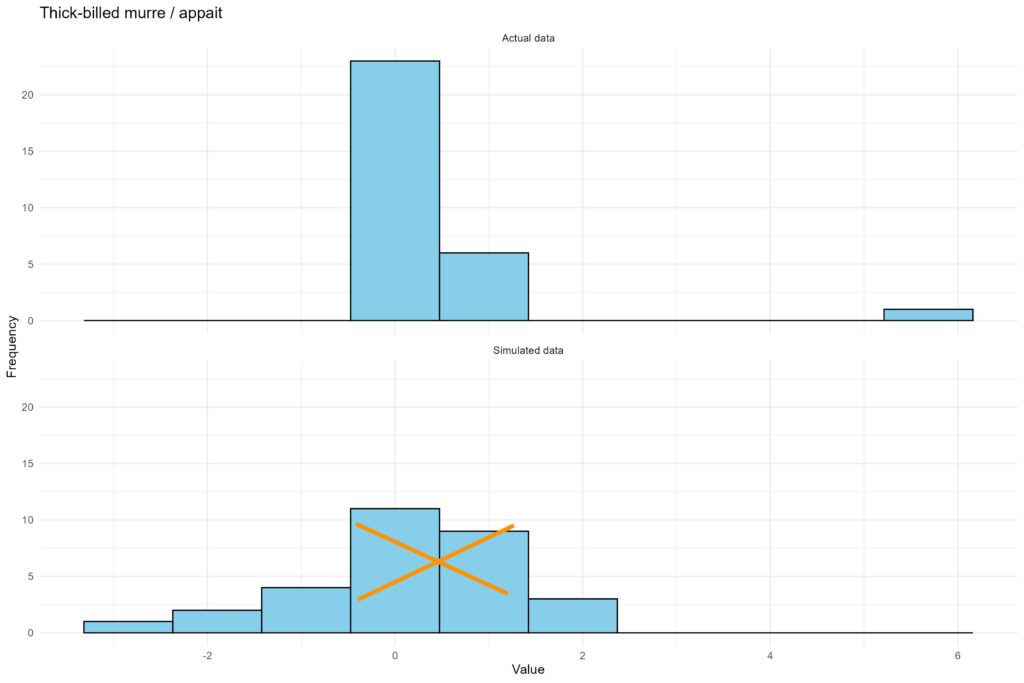
Bottom: A simulated set of data with the same average and sample size.
But other things disappear as well. For Turrs, one bird had ingested six pieces of plastic. That one high number changes the average, making it seem like plastic ingestion is more common across the board when it isn’t. Even more importantly one high number matters, especially since these birds have all been eaten by the hunters who gather samples for us. Fortunately, six small plastic fragments didn’t pose a health risk in this case, but it still reminds us why every data point matters. As researchers, we need to pay attention to that one high number and explain what’s going on.
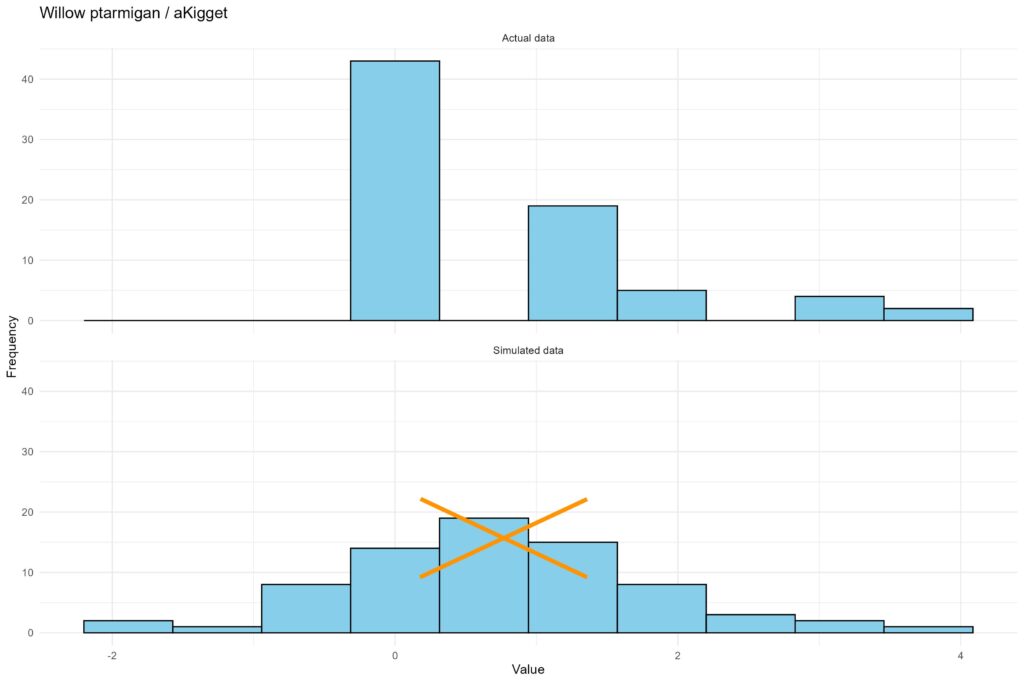
Bottom: A simulated set of data with the same average and sample size.
Species differences also came into focus. The graph above is for Patridge. While both species mostly had zeros, Partridge ingest more plastics more often than Turrs. Turrs are marine birds. Partridges forage on land. They eat different things in different environments. Unsurprisingly, they ingest plastics differently, too. That’s why in plastic pollution research, it’s common practice to analyze species separately, and why lumping them together can be misleading.
This Is About Statistical Ethics
This isn’t just about numbers. It’s about ethics in two important ways.
First, misleading summaries create misleading research. When researchers rely on models that assume data fits a bell curve, they may unintentionally distort the real story their data is telling. That’s an ethical problem about statistical methods, especially when better methods exist.
Second, the stakes of getting the statistics right are high. We’re talking about food that Inuit have the right to hunt, harvest, and eat. These animals are central to Inuit culture, health, and sovereignty. This means that you start to impact Indigenous rights when your statistics about wild food are misleading.
We urge other researchers to take care with how we handle and report our data. Make sure your model fits your data. Remember that food safety and the right to food sovereignty are impacted in how you choose to summarize your numbers. And never forget that sometimes, zero is the most important number of all.