Table of Contents
- What we found
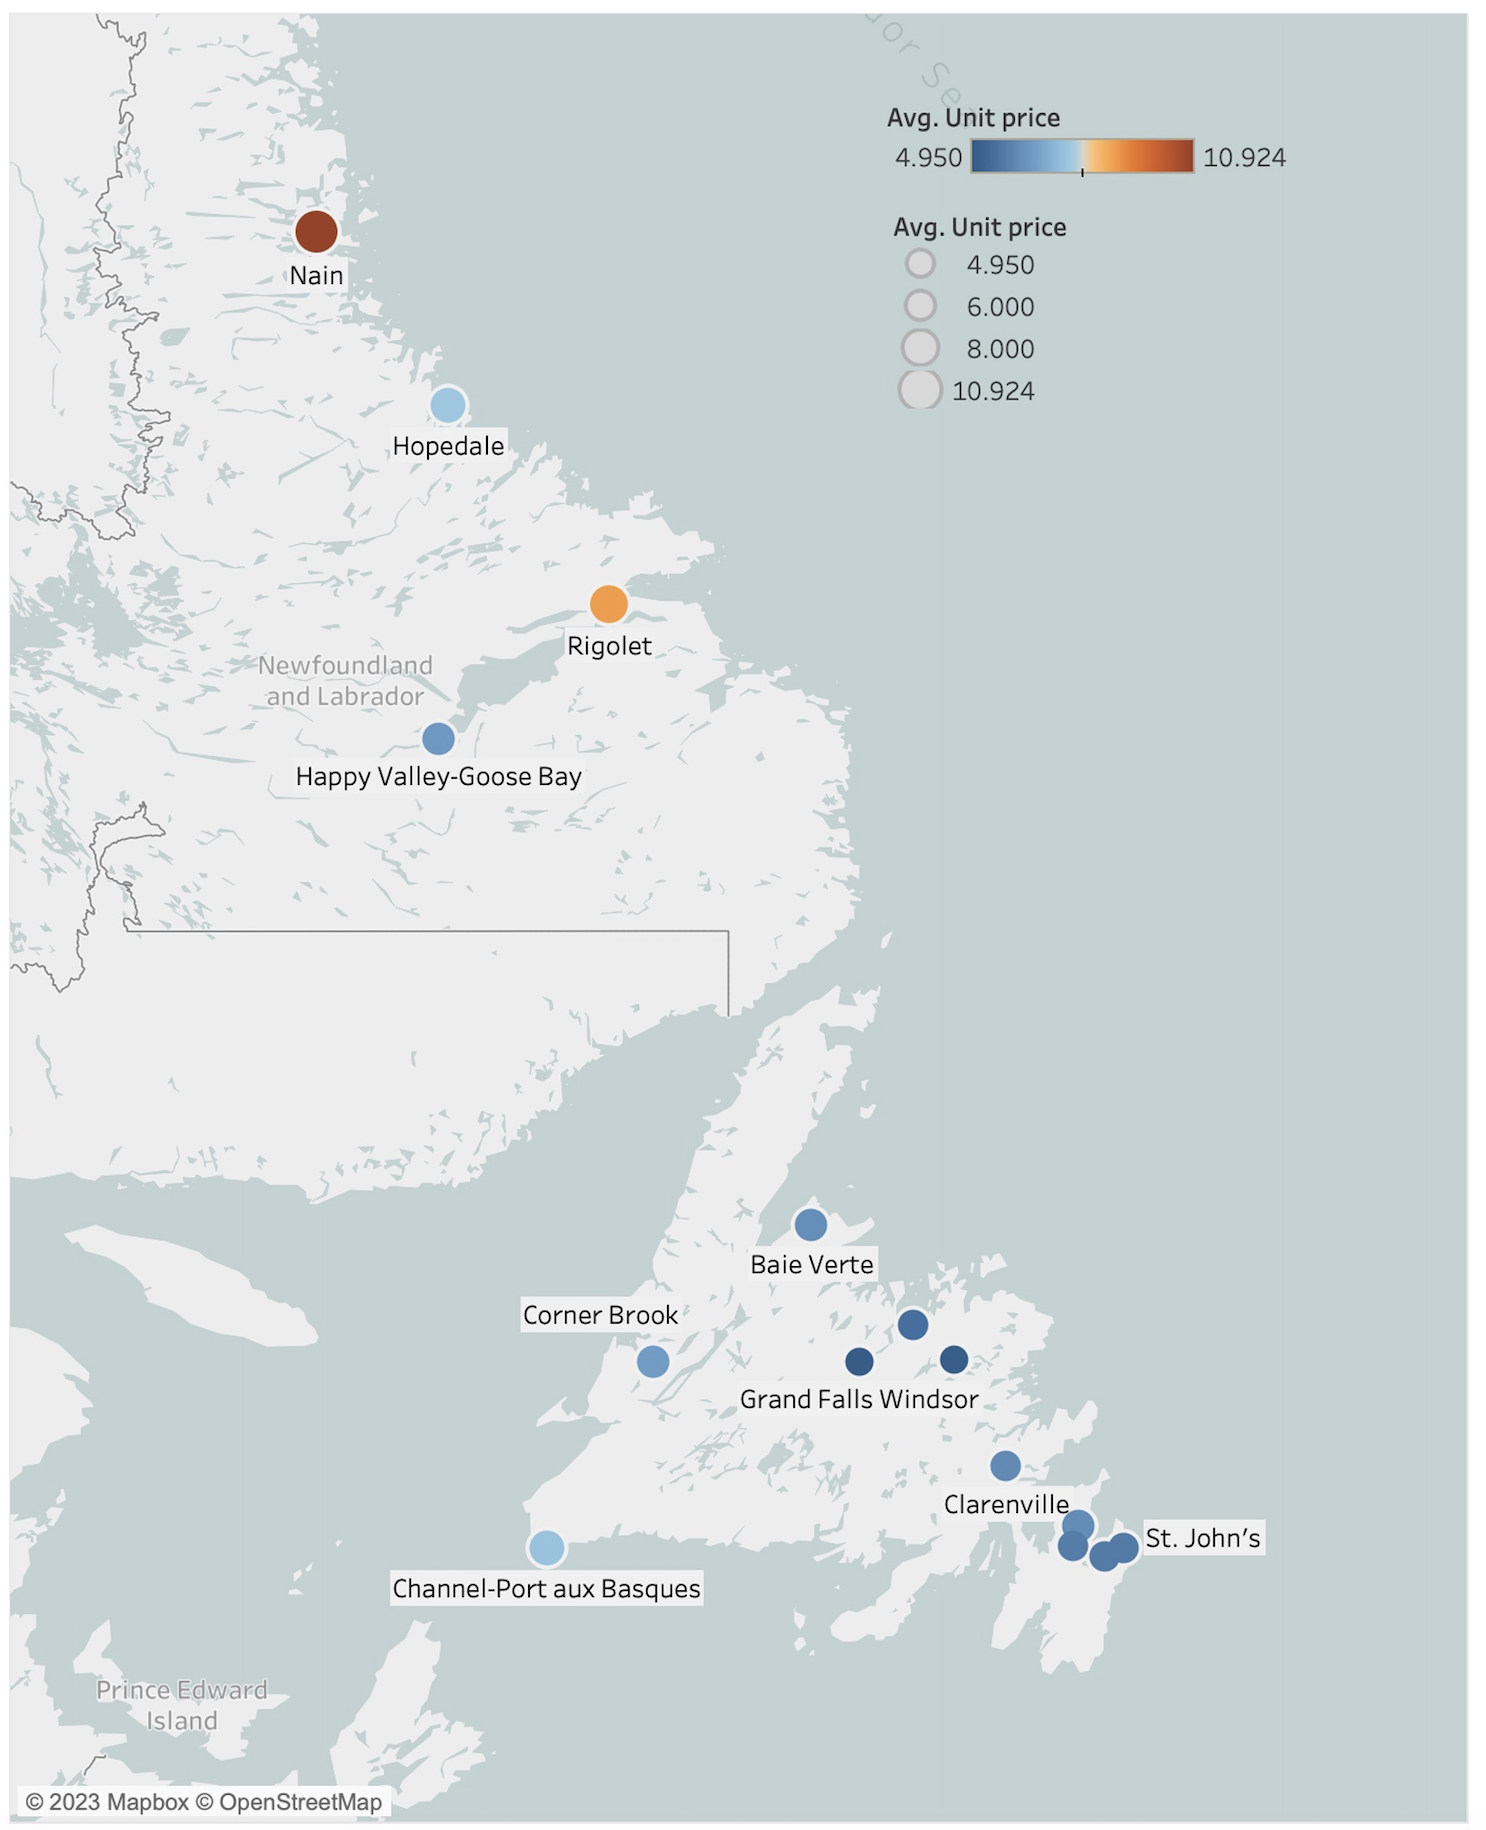
- Average food prices by location in Newfoundland and Labrador
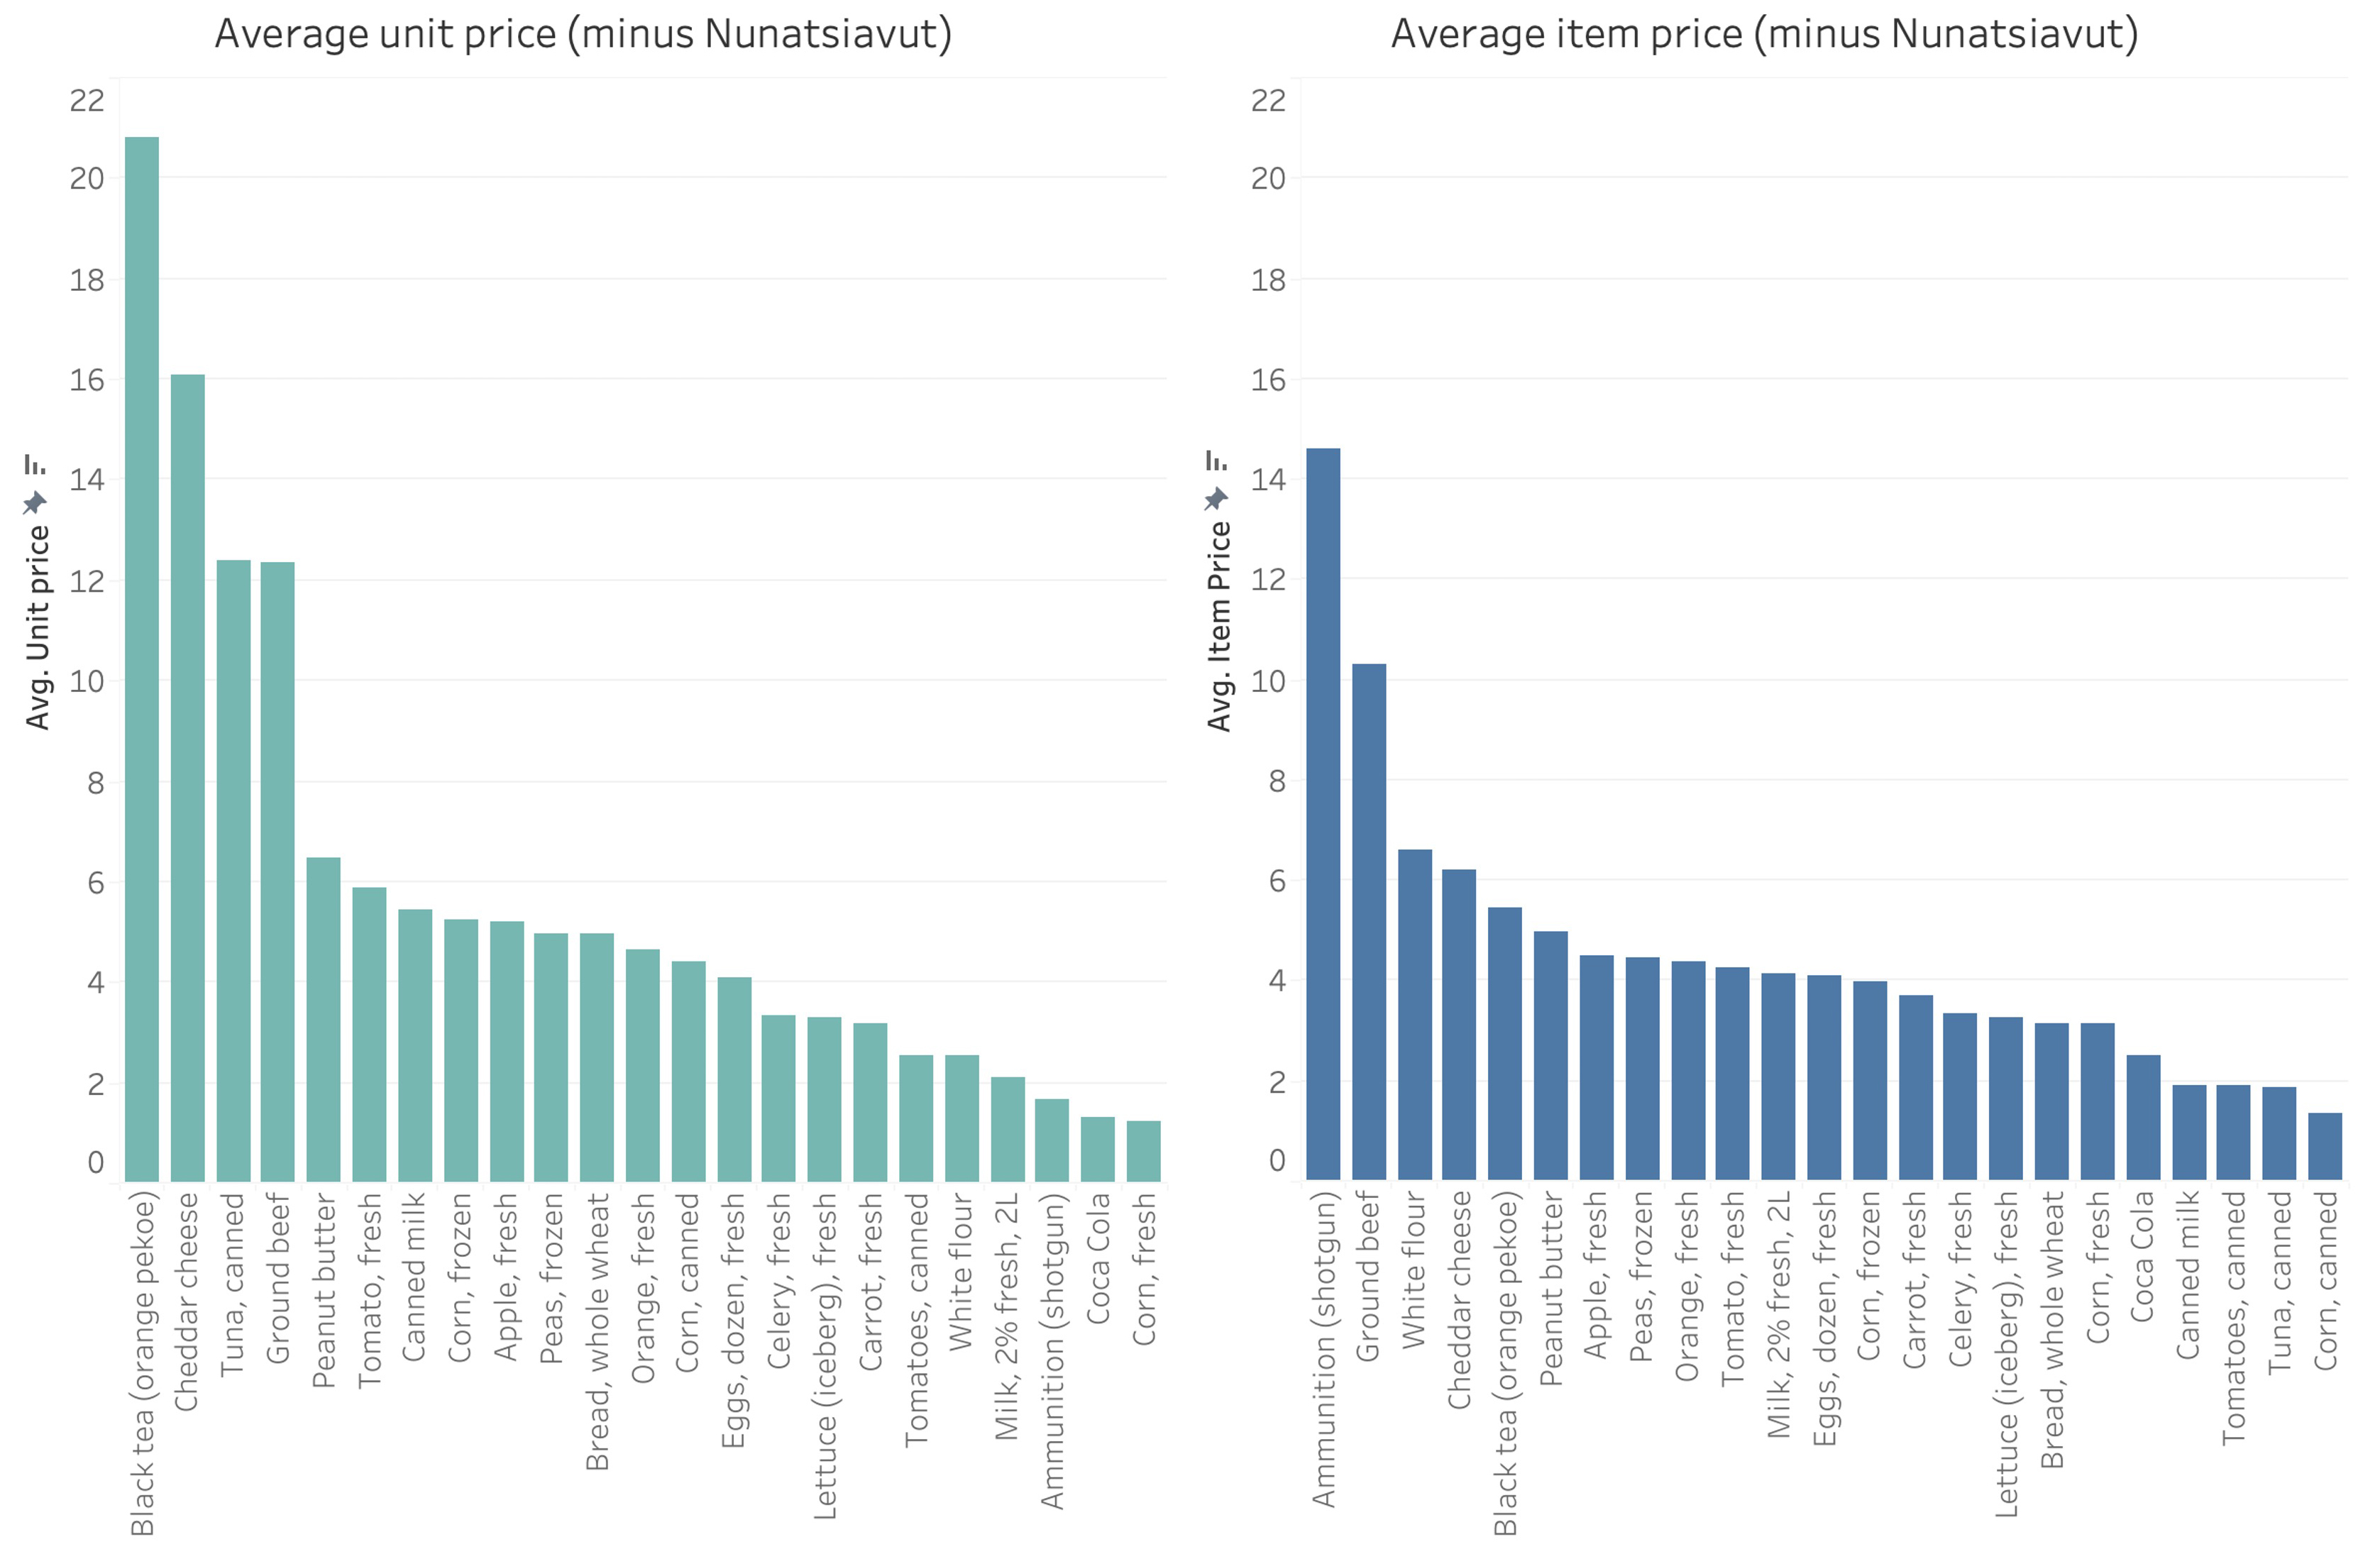
- Average unit price and item price for key food items in Newfoundland and Labrador
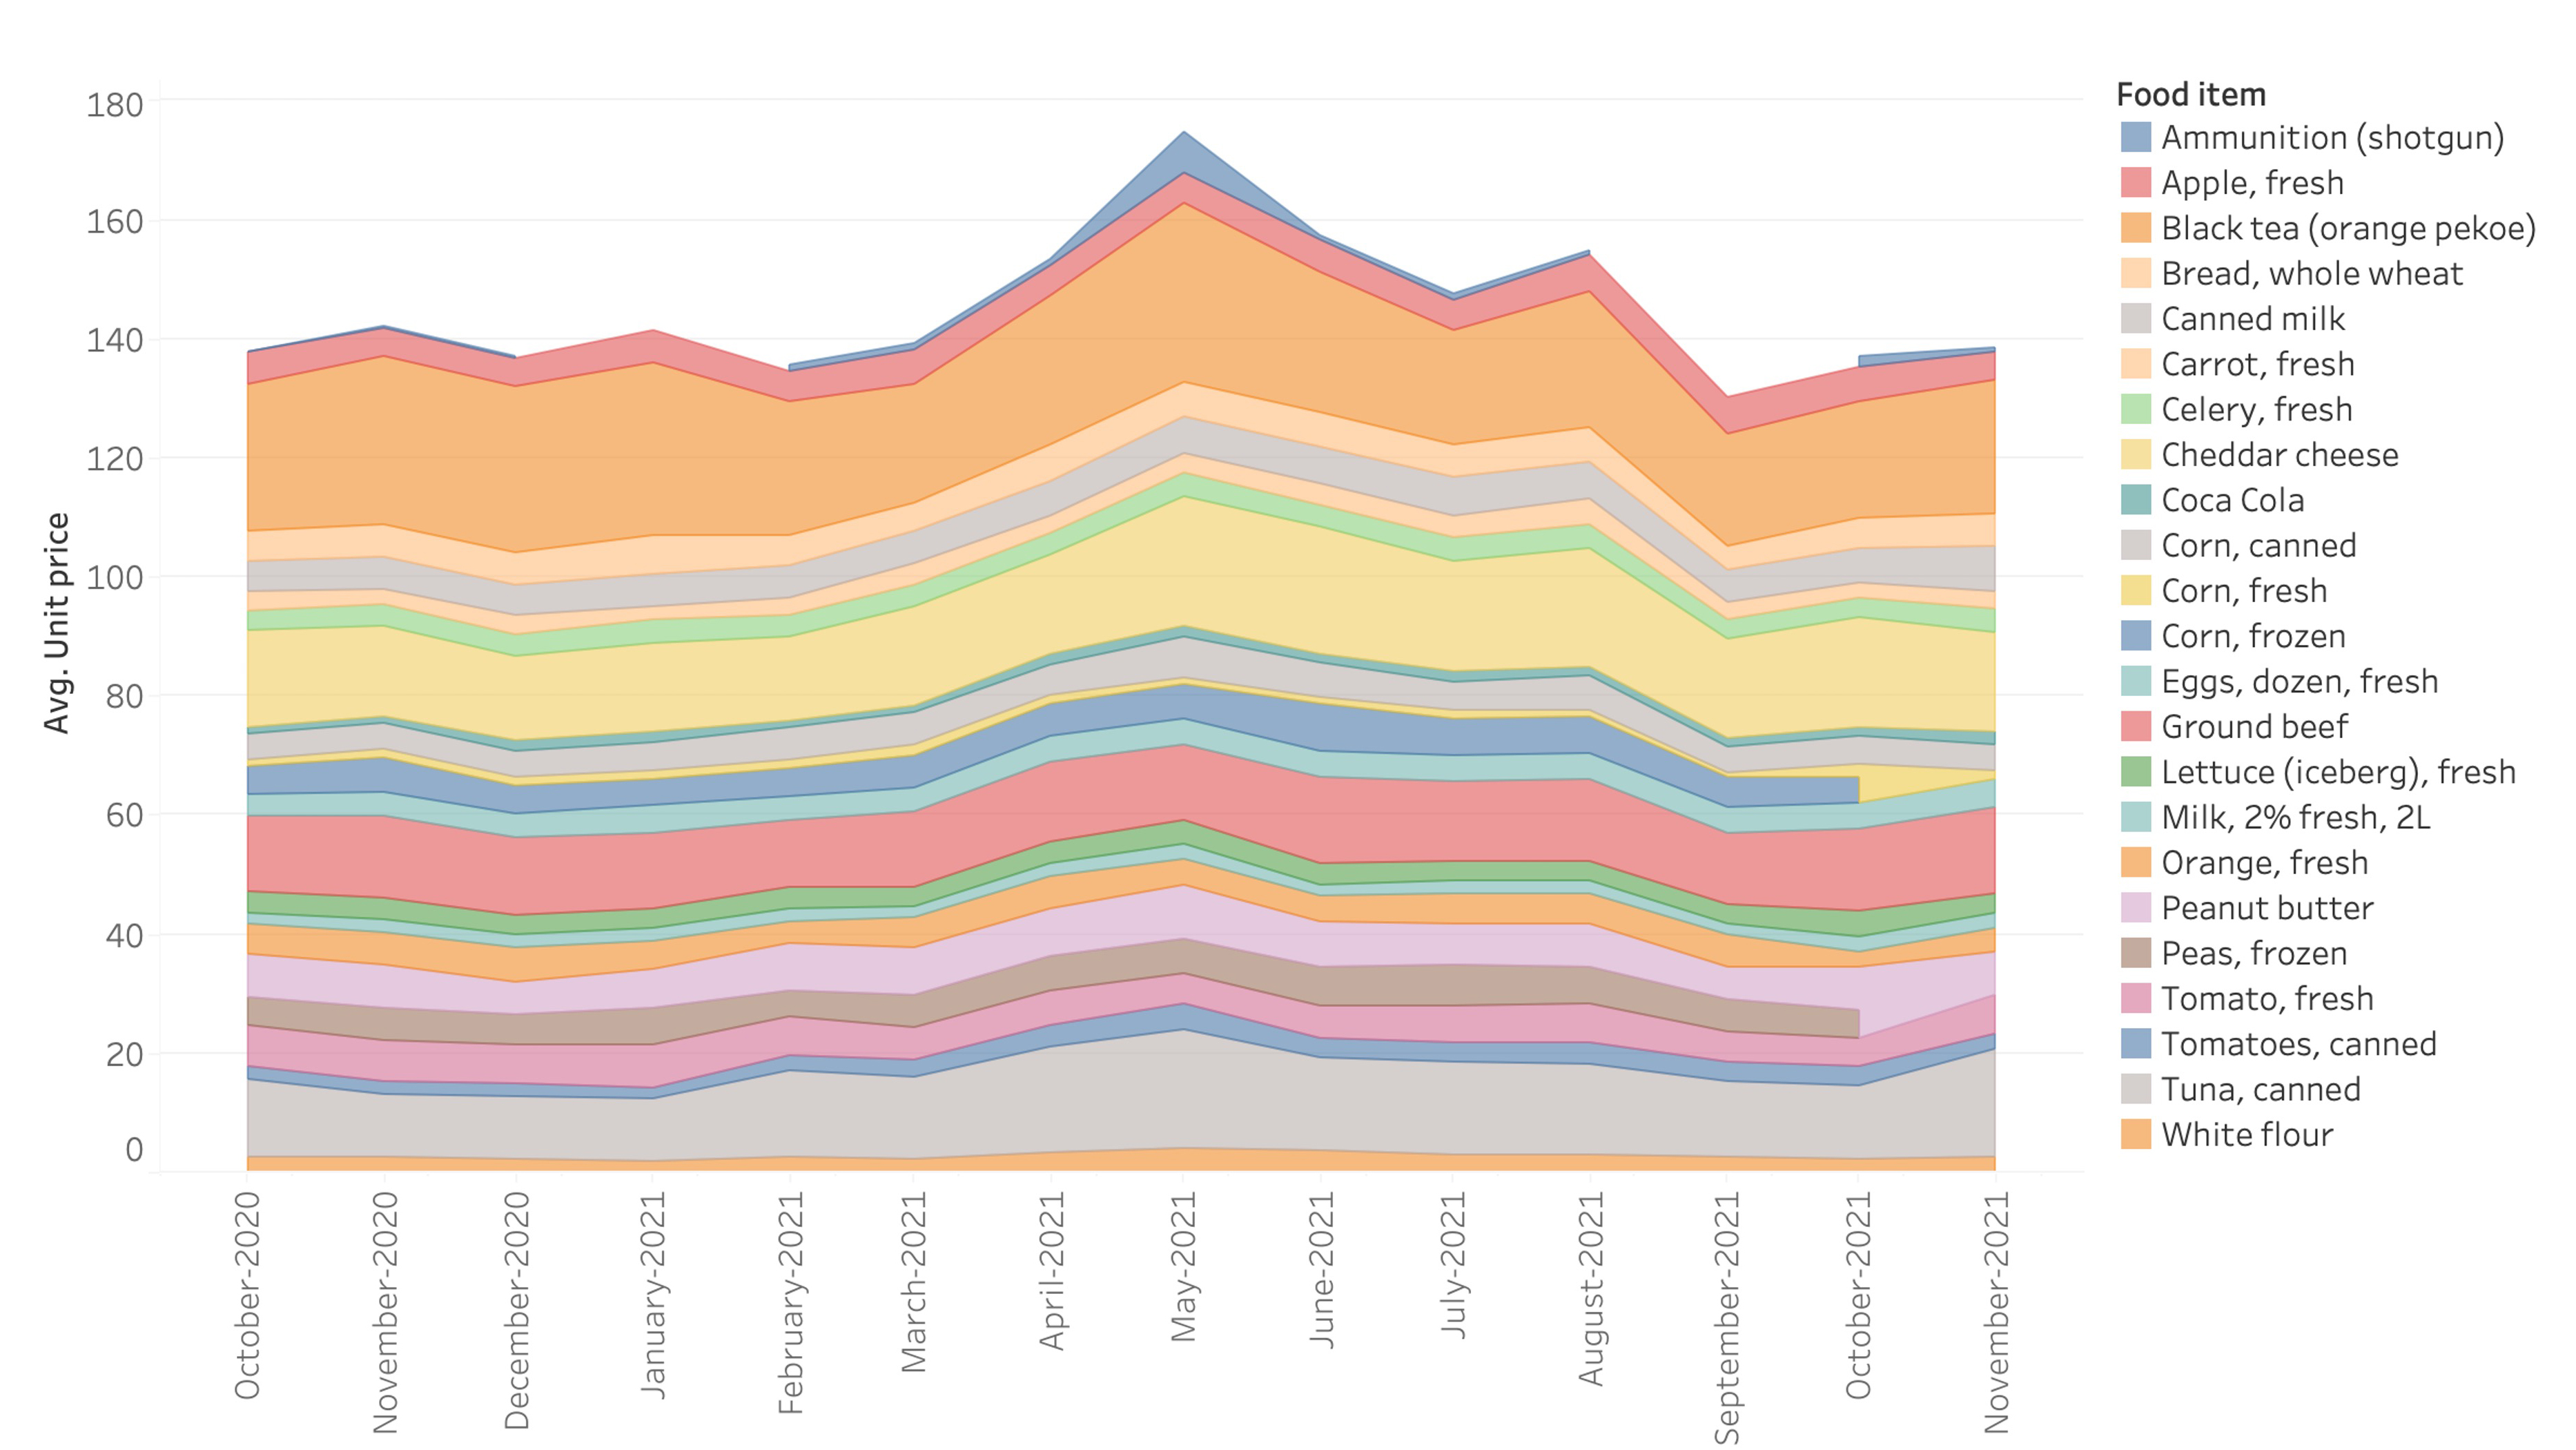
- The average unit price of food items in Newfoundland and Labrador during the entire study period (October 2019–December 2021)
- The variance of food pricing by location in Newfoundland and Labrador
- Average food pricing by local and retailer
- Comparison of item prices for fresh (yellow), frozen (blue), and canned (grey) corn
Through collaborative efforts between the Nunatsiavut Government, the Social Justice Co-operative, and CLEAR Lab at Memorial University, the NL Food Pricing Project was developed in response to growing concerns about the cost of living in Newfoundland and Labrador. According to Proof Canada (2017), one in six households in the province experience food insecurity. This means Newfoundlanders and Labradorians worry about running out of food, limit their food selection due to lack of funds, compromise the quality and/or quantity of their food, or miss meals or reduce their food intake because of the cost or accessibility of food.
For over a year between 2020 and 2021, volunteers collected data on the pricing of a set number of food items in their communities. We then co-analyzed results to answer questions pertaining to food security issues that are important in Newfoundland and Labrador. This was a community-based, collaborative effort—the project was designed to incorporate community knowledge and concerns at every step, from citizen scientist data collection to public meetings to collaboratively interpret the data. We sincerely thank everyone who participated!
What we found
According to the grocery store data collected by volunteers across Newfoundland and Labrador:
- Regionally, Nunatsiavut has the highest average prices of food, particularly in Nain.
- Food pricing across the province is characterized by high variability over time (large differences between the highest and lowest pricing). Nain has the greatest variability of food pricing, followed by Port Hope Simpson, Rigolet, and Port aux Basques. These are the same places with some of the highest food costs.
- The foods with the highest variability in pricing on our list are black tea, canned tuna, and cheddar cheese. The most stable prices are for fresh milk, fresh corn, Coca Cola (or Pepsi), and eggs.
- The food retailer (grocery store chain) has less impact on food pricing than location, meaning that different retailers in the same place are more aligned in pricing than the same retailer in different places.
- Local prices are impacted by national and geopolitical trends such as the federal rise in inflation.
We invite you to learn more about the variability in food pricing in Newfoundland and Labrador by viewing the full report.
The dataset is free and available for others to use here. If you use the data in professional reports or communications, please cite the dataset.
Dataset DOI: 10.5281/zenodo.7712681
Media Contact: Data collector Corinne Neil (cneil766@gmail.com) & Project coordinator Max Liboiron (mliboiron@mun.ca)
General and research Inquiries: clearlab@mun.ca, https://civiclaboratory.nl/
This project is a partnership between:

This project is funded by the Public Engagement Fund, Office of Public Engagement at Memorial University, the Memorial Undergraduate Career Employment Program, the Smallwood Foundation, and a Social Science and Humanities Research Council Insight Grant.
Average food prices by location in Newfoundland and Labrador
Average unit price and item price for key food items in Newfoundland and Labrador
The average unit price of food items in Newfoundland and Labrador during the entire study period (October 2019–December 2021)
The variance of food pricing by location in Newfoundland and Labrador

Average food pricing by local and retailer

Comparison of item prices for fresh (yellow), frozen (blue), and canned (grey) corn
