Designing a plastic study with BabyLegs
How to choose the type of study that will answer your research questions
BabyLegs is a build-it-yourself, low-cost surface water trawl for monitoring microplastics. It is primarily used for understanding the relative types of plastics in an area. This means identifying the main sizes, shapes (morphologies), colours, and potential sources of plastics. Nearly any study design will involve doing multiple trawls to make sure you have a good sample, but the number, locations, and timing of those trawl tows depend on what you want to know.
What do you want to know?
The starting point for all research is the research question(s). What do you want to know? The design will follow from those questions. There are a few basic kinds of questions you can ask in a plastics study, and each has its own study design:
- What plastics are out there, anyhow? If you are starting with no previous knowledge of plastic pollution in an area, you may want to do a characterization study. This study design is a snapshot of the types, sizes, colours, weights, erosion patterns, and other discernable properties of the plastics at a particular place at a particular time. If you want to know about a particular area, you can use random sampling at various points to make sure you’re getting a good snapshot of the area. These should all be done in the same day or two, since seasons, wind direction, tidal flows, and weather can all impact plastic pollution.
- What is the state of plastic pollution in the area so we can see if there are changes over time? If you want to create a state of knowledge that allows you to measure future changes to see if the problem is getting worse or better, you may want to do a baseline study. Baseline studies include the components of a characterization study above, as well as a measure of the concentration of plastics (the number of plastics per unit of water). BabyLegs does not allow you to measure concentration without some additional measures (no trawl does). See the section below on concentration. Baselines are created for comparison at a later date. You must make your baseline methods exactly reproducible at a later date, whether that is in exactly a year in the same season and during the same weather to see if the base characterization and concentration changes annually, or in another season to see if seasons impact plastic loading. Your notes on methods have to be clear and detailed.
- We think plastics are coming from a particular source. How do we tell if they are? A source study is a common type of plastic pollution study, particularly for sewage treatment plants. This type of study includes characterization and concentration, and sample locations are chosen based on distance from the assumed point source of pollution. You sample at regular intervals moving away from the source with the assumption that the concentration of plastics will decrease as you move away, and/or the type of plastics associated with the point source will grow less common as you move away.
- We want to compare two places’ plastics to one another to see how they are different. This can take the shape of a characterization or a baseline study, but it will involve quite a few trawls from each of the two areas. Then, you compare how characteristics and/or concentrations in the two areas relate to one another. Doing a number of trawls in each area helps establish an average reading on each location as well as telling you about the variability in a location that can help you determine whether the differences between the two locations are due to chance or are more meaningful. An area with high variability between samples means it will be harder to make a sound comparison.
The main ways plastic pollution is reported in scientific studies
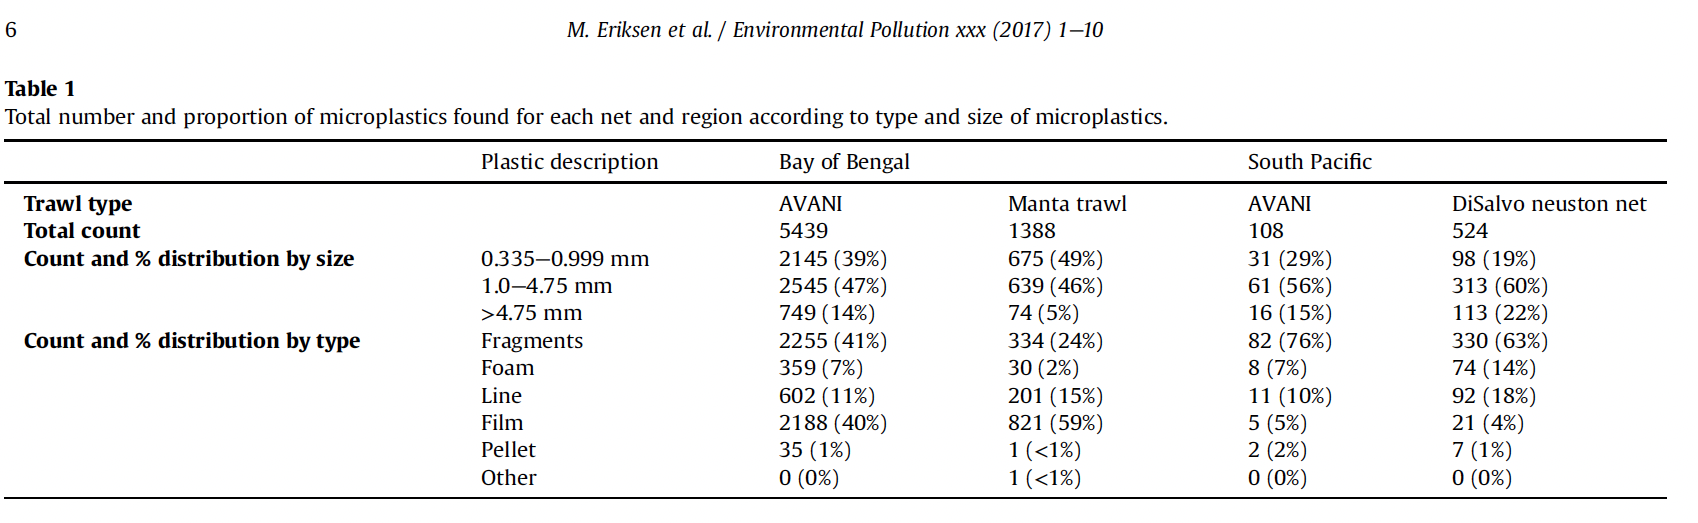
Eriksen, Marcus, Max Liboiron, Tim Kiessling, Louis Charron, Abigail Alling, Laurent Lebreton, Heather Richards et al. “Microplastic sampling with the AVANI trawl compared to two neuston trawls in the Bay of Bengal and South Pacific.” Environmental Pollution 232 (2018): 430-439.
The table above is taken from a plastic pollution trawl study that compared plastics in two different areas using two different trawls. You can see that it includes the number of plastics and the percentage of plastics in each area (and per trawl). In another table, it also included the concentrations.
- Size class: Plastics are divided into three size classes. Macro plastics are larger than 4.57 mm and are rare (unless plastics are local). Meso plastics are between 1 and 4.75mm, and microplastics are smaller than 1mm. The most important measure is the longest side of the plastic, which has to fit within the size class. You can also calculate average size, median size, etc.
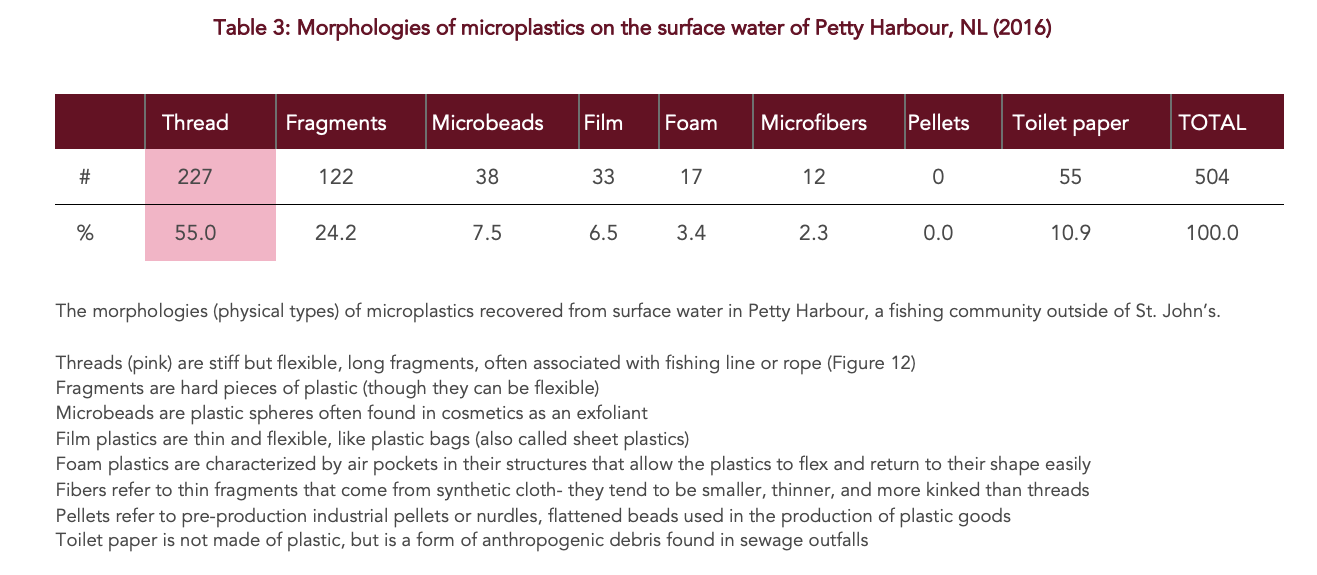
- Morphology: Plastics come in a few standard forms called morphologies: fragments, foams, films, threads, microfibres, microbeads, and pellets (see our forensics guide for details). Each morphology correlates to different sources.
- Concentration: Concentration is the number of plastics per unit of water (e.g. 34 plastics/m^2). BabyLegs does not automatically tell you the concentration of plastics in an area unless you have a way of also measuring the amount of water that passes through its mouth such as a flowmeter, which is more expensive. This is the flowmeter we use at CLEAR. If the water you are monitoring is relatively still (no strong current or tides) and you are propelling BabyLegs through the water manually, then you can use distance as a proxy for volume. Use the width of BabyLeg’s mouth and multiply to get the square unit of water. Historically, studies use square units (surface area) rather than cubed units (volume) but you can use either.
- Colour: The primary colour of the plastics is often recorded. The most common colours globally are clear, white, and black.
- Erosion: There are different patterns of erosion that can be recorded (pitting, fraying, fracturing, etc), but just recording if something is worn/eroded or not can tell you whether it is local (not worn) or from long-distance transport (heavily worn, bleached, etc). Some studies note special erosion such as burning or bleaching that indicates particular patterns in their regions.
- Weight: The weight of each plastic and the total number of plastics is often recorded. Sometimes, the number of plastics divided by the weight is recorded, or the relationship between weight and size class to get a better idea of the amount of plastic, rather than just the number of items.
- Polymer type: Through spectrometry, you can determine the polymer type (such as PVC, PET, LDPE, nylon, etc.). This requires specialized equipment or outsourcing to a spectrometry lab.
What impacts plastic studies?
- Weather: Precipitation, strong wings and wind direction, high waves, and icing can all down-well plastics (force them further underwater). Often there is a higher concentration of plastics in the water in the hours and days after rainfall events as stormwater and sewage overflows sweep land-based plastics into waterways.
- Seasons: Ice can archive plastics (keep them stored in the ice) and they can be released all at once in a thaw. Runoff, melt-off and other spring weather can increase plastic loads. Nearly all plastic research is conducted in the summer months, even though it represents a particular seasonal snapshot of plastic pollution. Comparative studies should always be done in the same seasons.
- Gunky water: When the water has significant algae, seaweed, or slub, the organics snare plastics as well as clog trawls. We once ran our trawl through a seaweed float. We do not recommend doing that.
- Technical issues: If your trawl doesn’t function consistently (e.g. it twists in the water, it dives underwater, it flies above the water sometimes but not other times), it can impact your samples significantly. You can still do a characterization study with glitching tech, but your concentration measures will not be accurate and you will not be able to do any comparison studies (baseline, source study, location comparison). If you have high variability between your samples, this may indicate a technical malfunction where you just aren’t sampling the same way each time. Even just changing the trawl can impact the reproducibility of your study.
- Contamination: it is impossible to do plastic research without plastics! Bits of plastics can come from your sample bags, clothing, boat, ropes, and other gear. Microfibres are a major component of house dust and can land in your sample as you work. You should gather contamination samples to compare to your final sample to ensure the plastics you are counting came from the water, not your science! (see the trawling protocol on how to make a contamination blank)
Some examples of plastic analyses from CLEAR lab