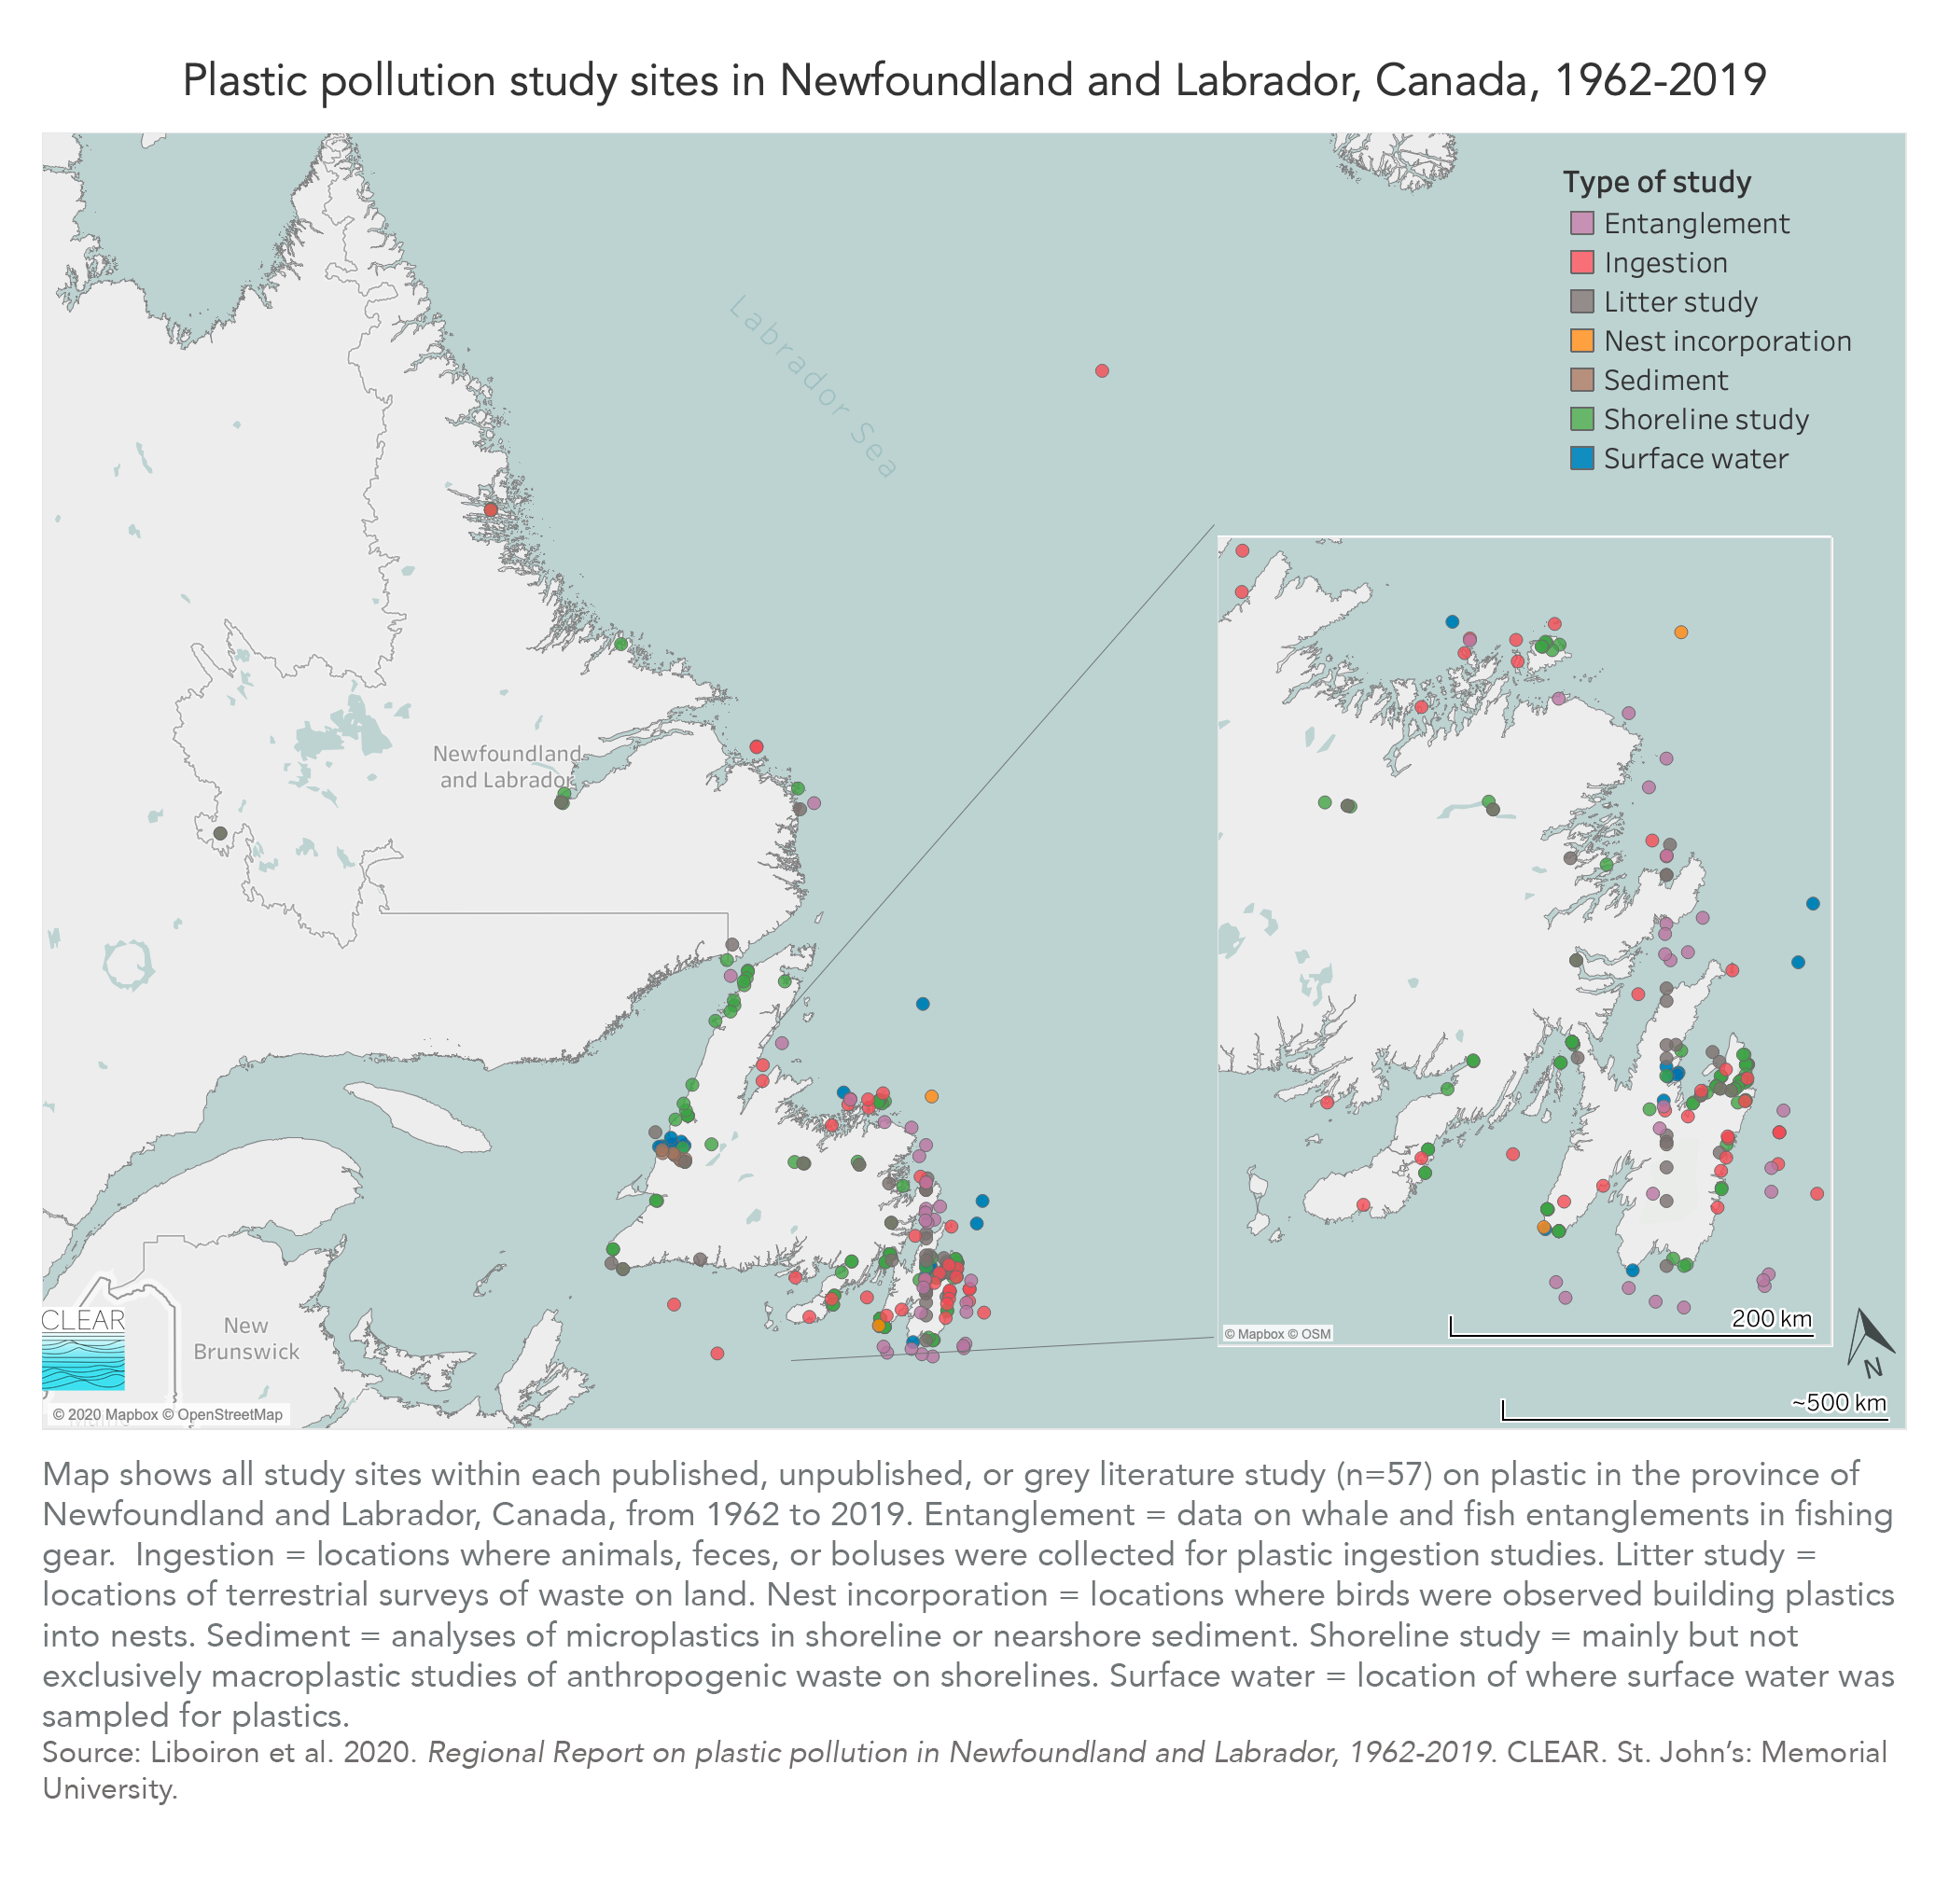
CLEAR’s Regional report on plastic pollution in Newfoundland and Labrador, 1962-2019 synthesizes all available data on plastic pollution in the Canadian province of Newfoundland and Labrador from 1962 to 2019. Using the findings from 57 published articles, unpublished datasets, and grey literature papers on plastics on shorelines, in surface water, and in sediment, plastics ingested by and that entangle animals, and plastics and other litter on land that can make its way into the ocean, this unique report paints a comprehensive picture of plastics pollution in the region. It is designed for a wide range of users.
Some of the major findings of the study include:
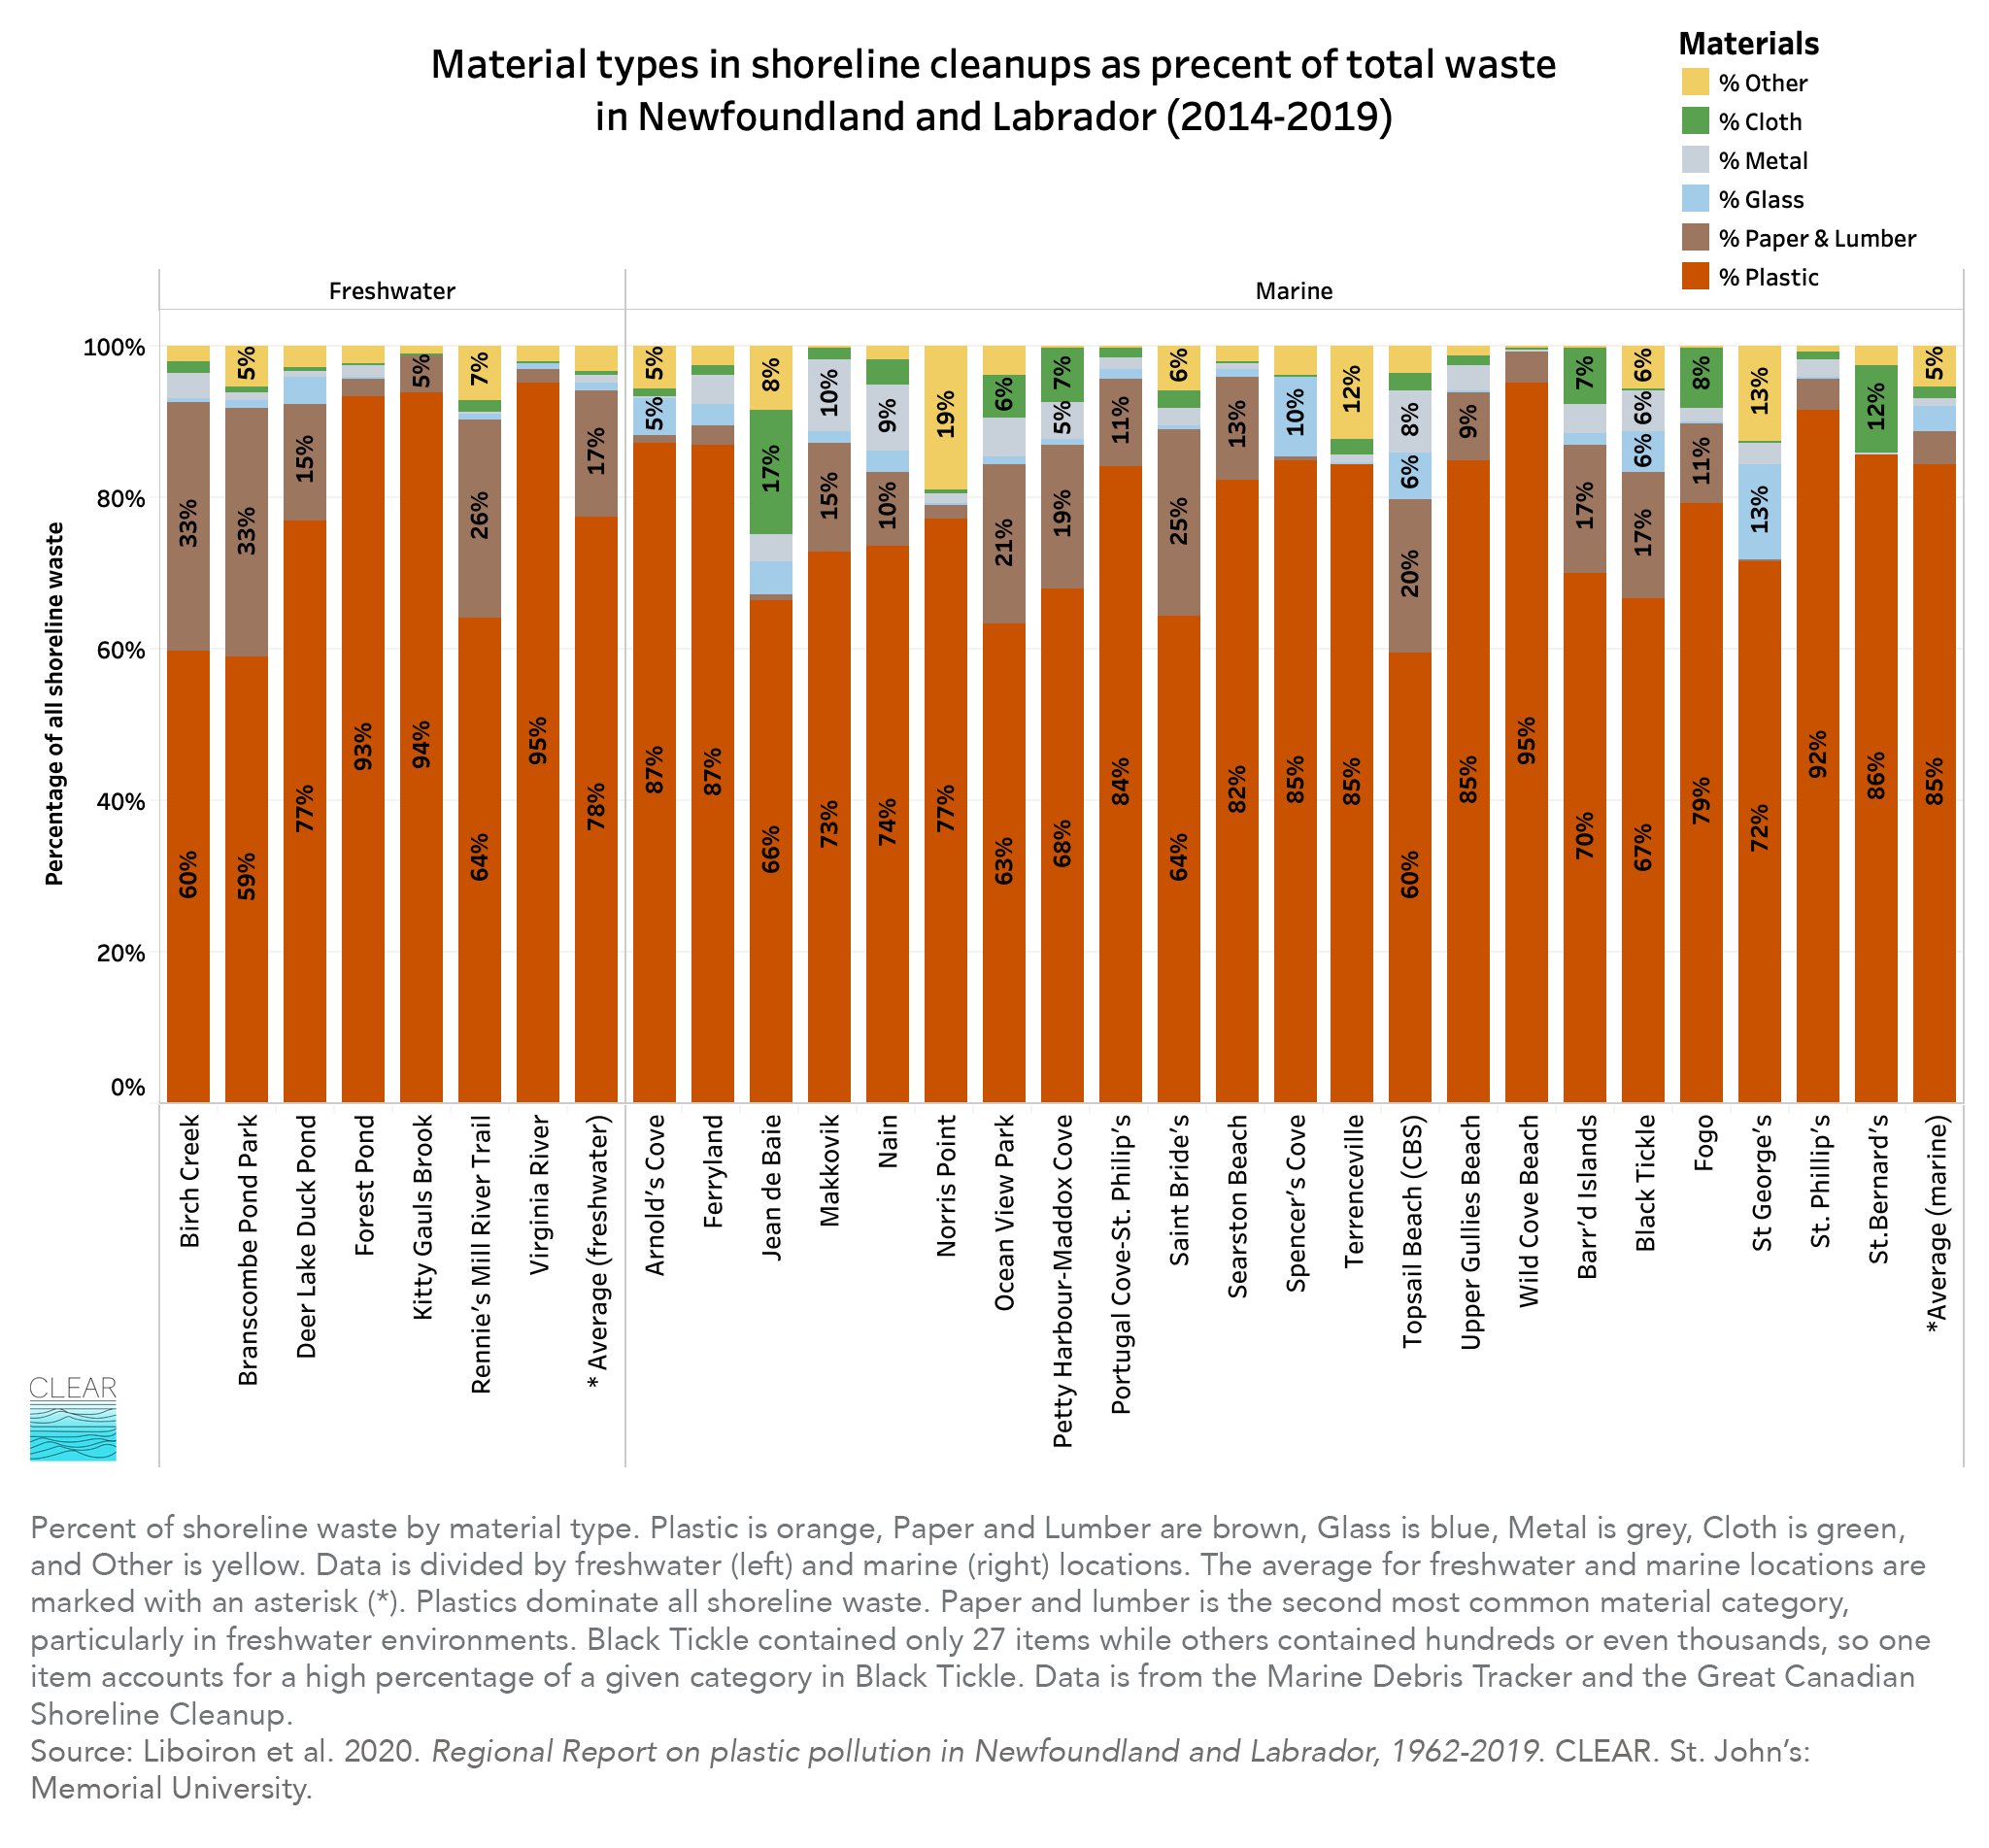
- Plastics account for 85% of all marine shoreline waste, a figure aligned with global figures. Of that, an average of all marine shoreline waste is 37% is fishing gear, though the number is highly variable and does not map onto areas with high commercial fishing activity. Freshwater shores have fewer plastics and fishing gear.
- The average density of plastics in marine surface water in the province is 5,208 pieces of plastic/km2.This is higher than it was a decade ago
- Cigarette waste accounts for over 88% of small terrestrial litter along highways, with the greatest densities in commercial areas. Approximately 24% of shoreline waste is cigarette butts.
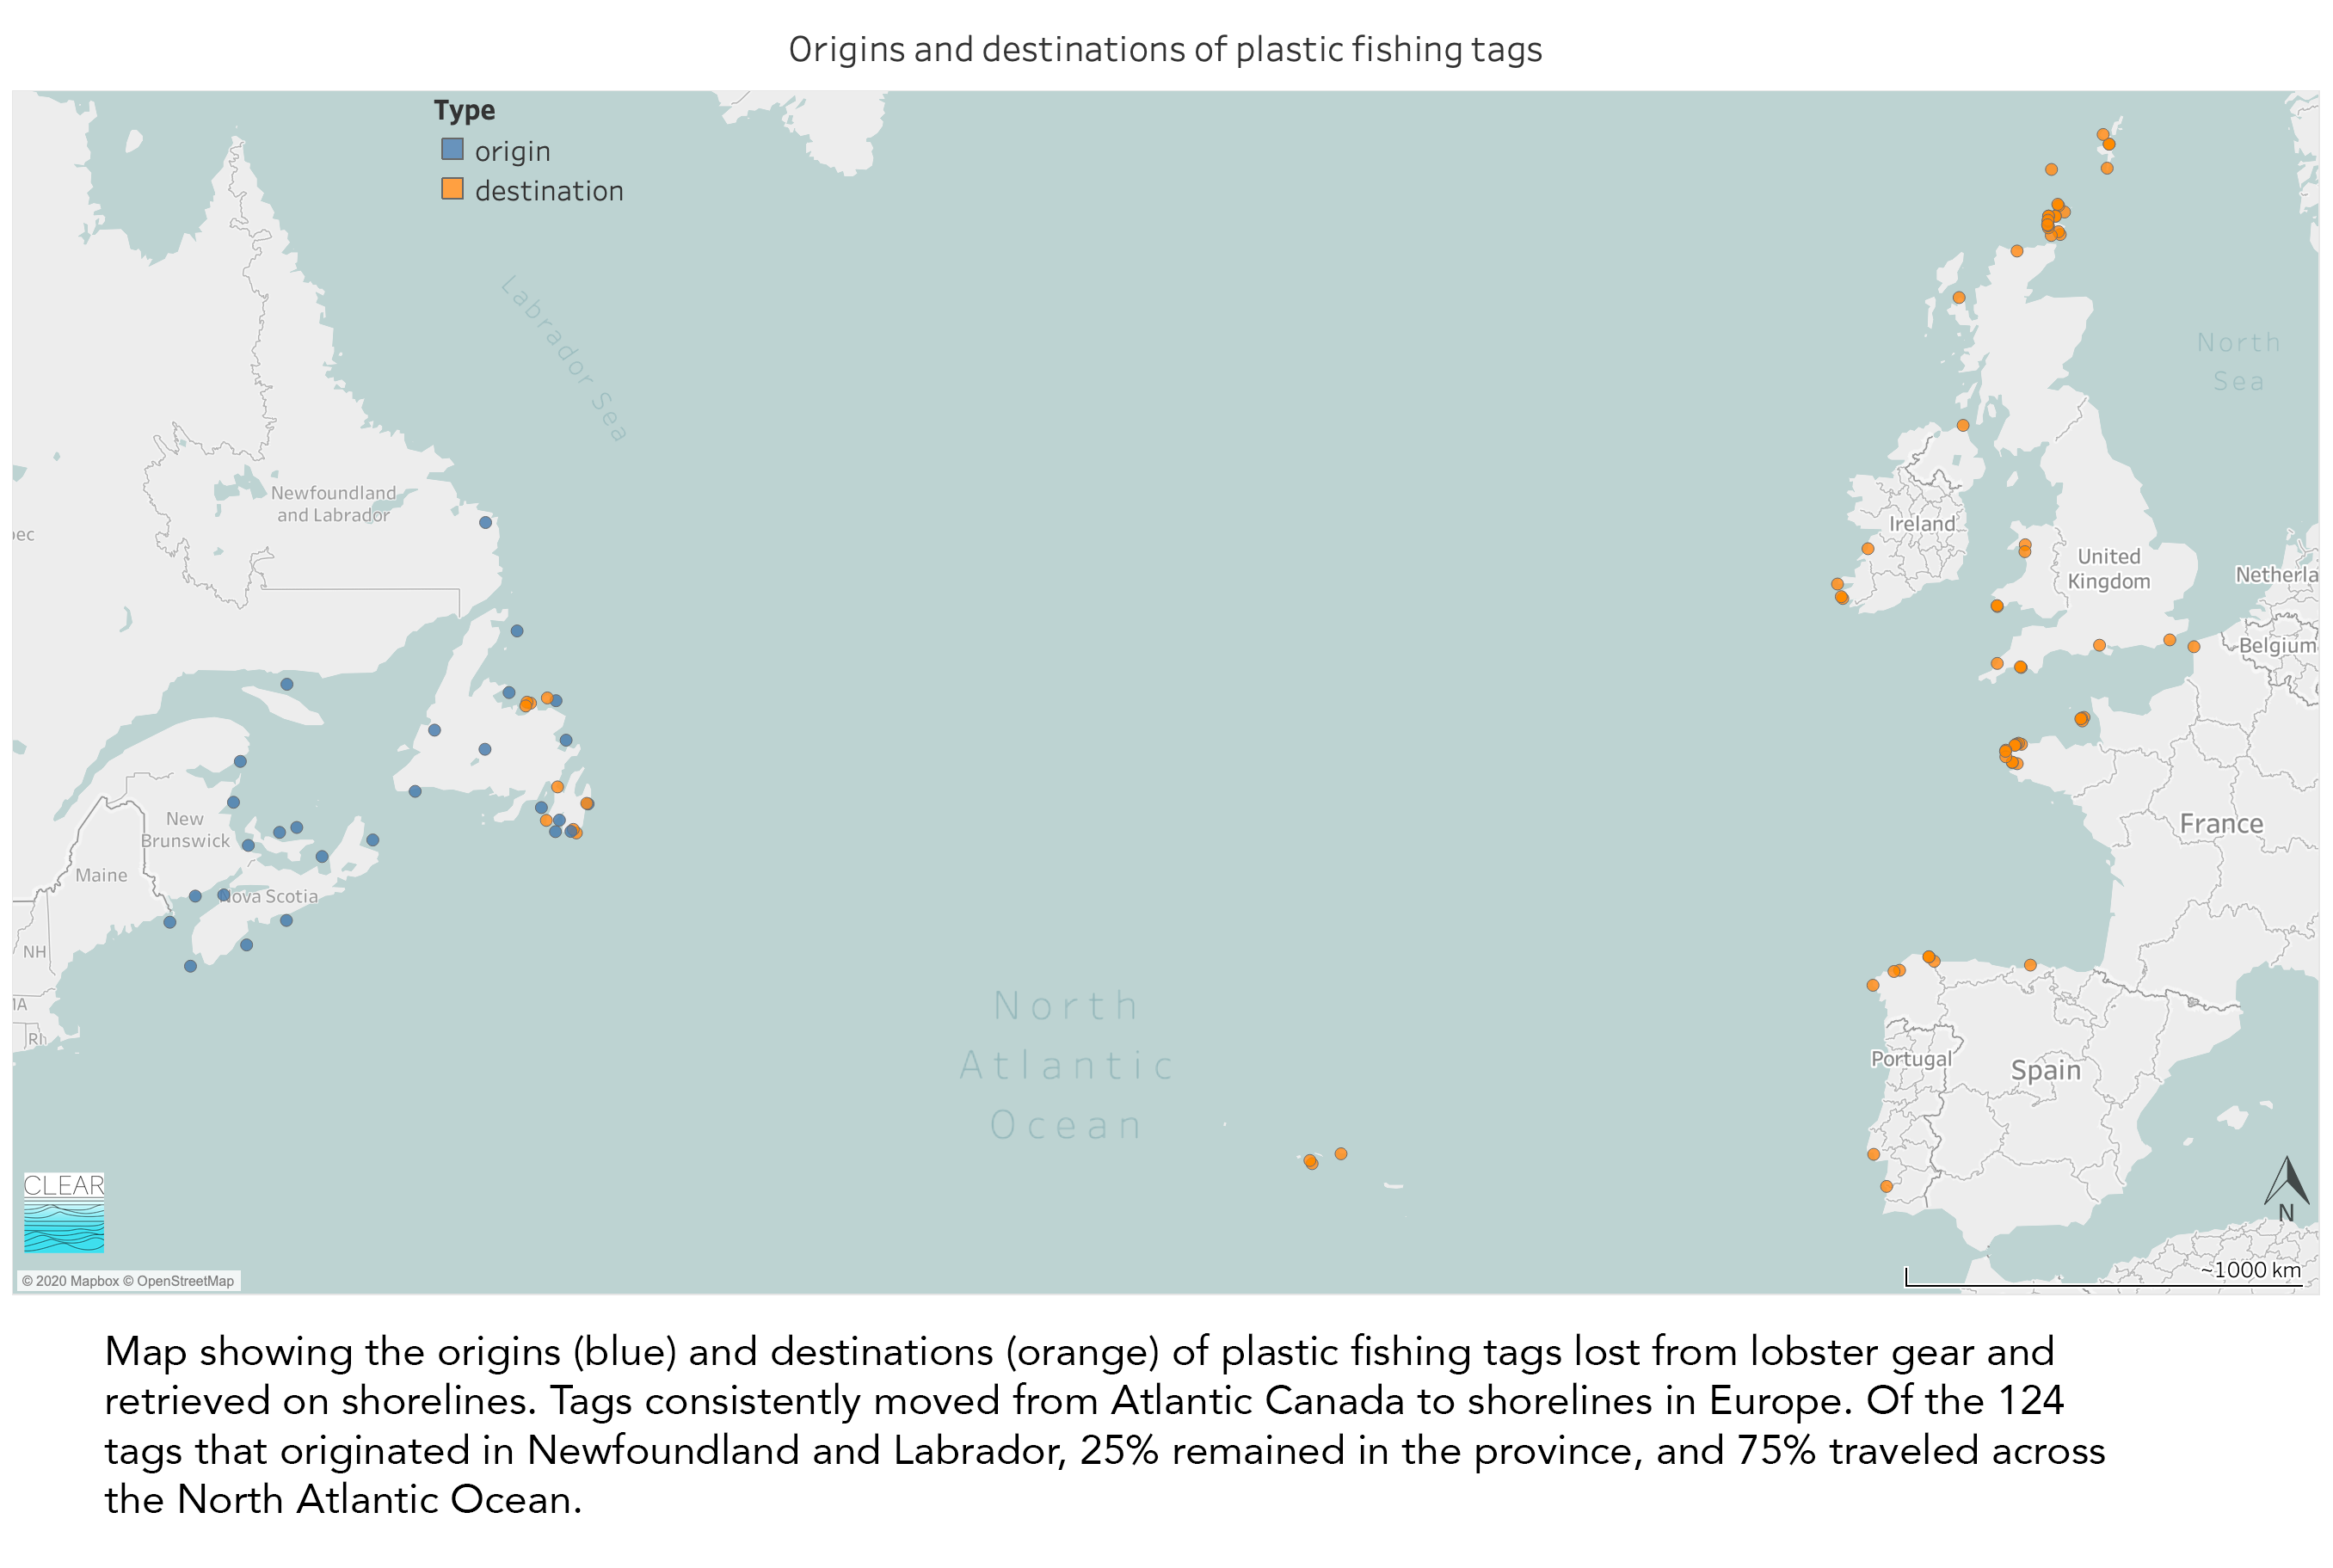
- The vast majority of plastic pollution found in Newfoundland and Labrador is expected to be from local or regional sources rather than from global sources. Much of the province’s plastics travel to the western coast of Europe, from northern Scotland to southern Spain.
- The uneven distribution of shoreline plastics in the province does not indicate there are regional hotspots at large or medium geographic scales. For instance, Labrador does not have less plastic pollution than the island of Newfoundland (though Labrador is currently understudied). Instead, there are smaller scale beaches with unusually high plastic accumulation called loading beaches, such as Arnold’s Cove and Terrenceville, while a beach a few kilometres away can be clear of waste.
- Over time, harms associated with macroplastics like whale entanglements in fishing gear have decreased since the cod moratorium in 1992, while harms associated with microplastics such as ingestion by birds and fish, have increased. For instance, plastic ingestion by Leach’s storm petrels has increased by 940% from the 1980s to the 2010s. Ingestion figures for nearly all species are increasing.
- The effect of banning plastic carrier bags on shoreline plastics is unclear. While plastic bags account for 2% of all marine shoreline plastics (higher for freshwater) and is lower than the Canadian average, a comparison of two municipal sites that have long banned plastic bags (Fogo Island and Nain) found that one site had a lower than average rate of plastic bags (less than 1%), while the other had one of the highest averages in the province (7.8%).
The following datasets used in the Regional report are available here:
Cite this report: Max Liboiron, Nadia Duman, Alex Bond, Louis Charron, France Liboiron, Justine Ammendolia, Kaitlyn Hawkins, Emily Wells, Jessica Melvin, Natalya Dawe, Melissa Novacefski. 2020. Regional Report on plastic pollution in Newfoundland and Labrador, 1962-2019. Civic Laboratory for Environmental Action Research (CLEAR). St. John’s: Memorial University.